
This submission is a presentation (like, GoogleSlides or PowerPoint) and will comprise a total of eight slides only. Do not submit more than eight slides. The first slide will include heading information (title, your name, class, etc…). The final slide will include sources. Three visual aids are required for the first section–one on each slide. Also, be sure to include at least 2 outside resources.
Below details what is required for each section:
*Review the video found at: Gerrymandering Explained
Section 1
(3 slides–do not submit more than 3 slides total for this part of the assignment) Don’t forget to include visual aids on each slide.
- For the first slide, in not less than 100 words, define ‘gerrymandering’ and be sure to use the word ‘redistricting.’ You must show an understanding of these two terms.
- For the second slide, in not less than 100 words, define ‘precinct’ and explain how gerrymandering relates directly to the House of Representatives.
- For the third slide, do an internet search to find any state that begins with the same letter as your first, middle, or last name, then report on any one instance of gerrymandering within that state. List which governor was responsible for this redistricting and explain the implications (did it benefit a certain political party…did it benefit a certain race of people, for example). You must choose one of the 50 United States. You must respond in not less than 100 words.
Section 2
(3 slides total–do not submit more than 3 slides total for this part of the assignment)
You will redistrict a zone in the same way that you see within the video link above. Here is an example of how redistricting looks:
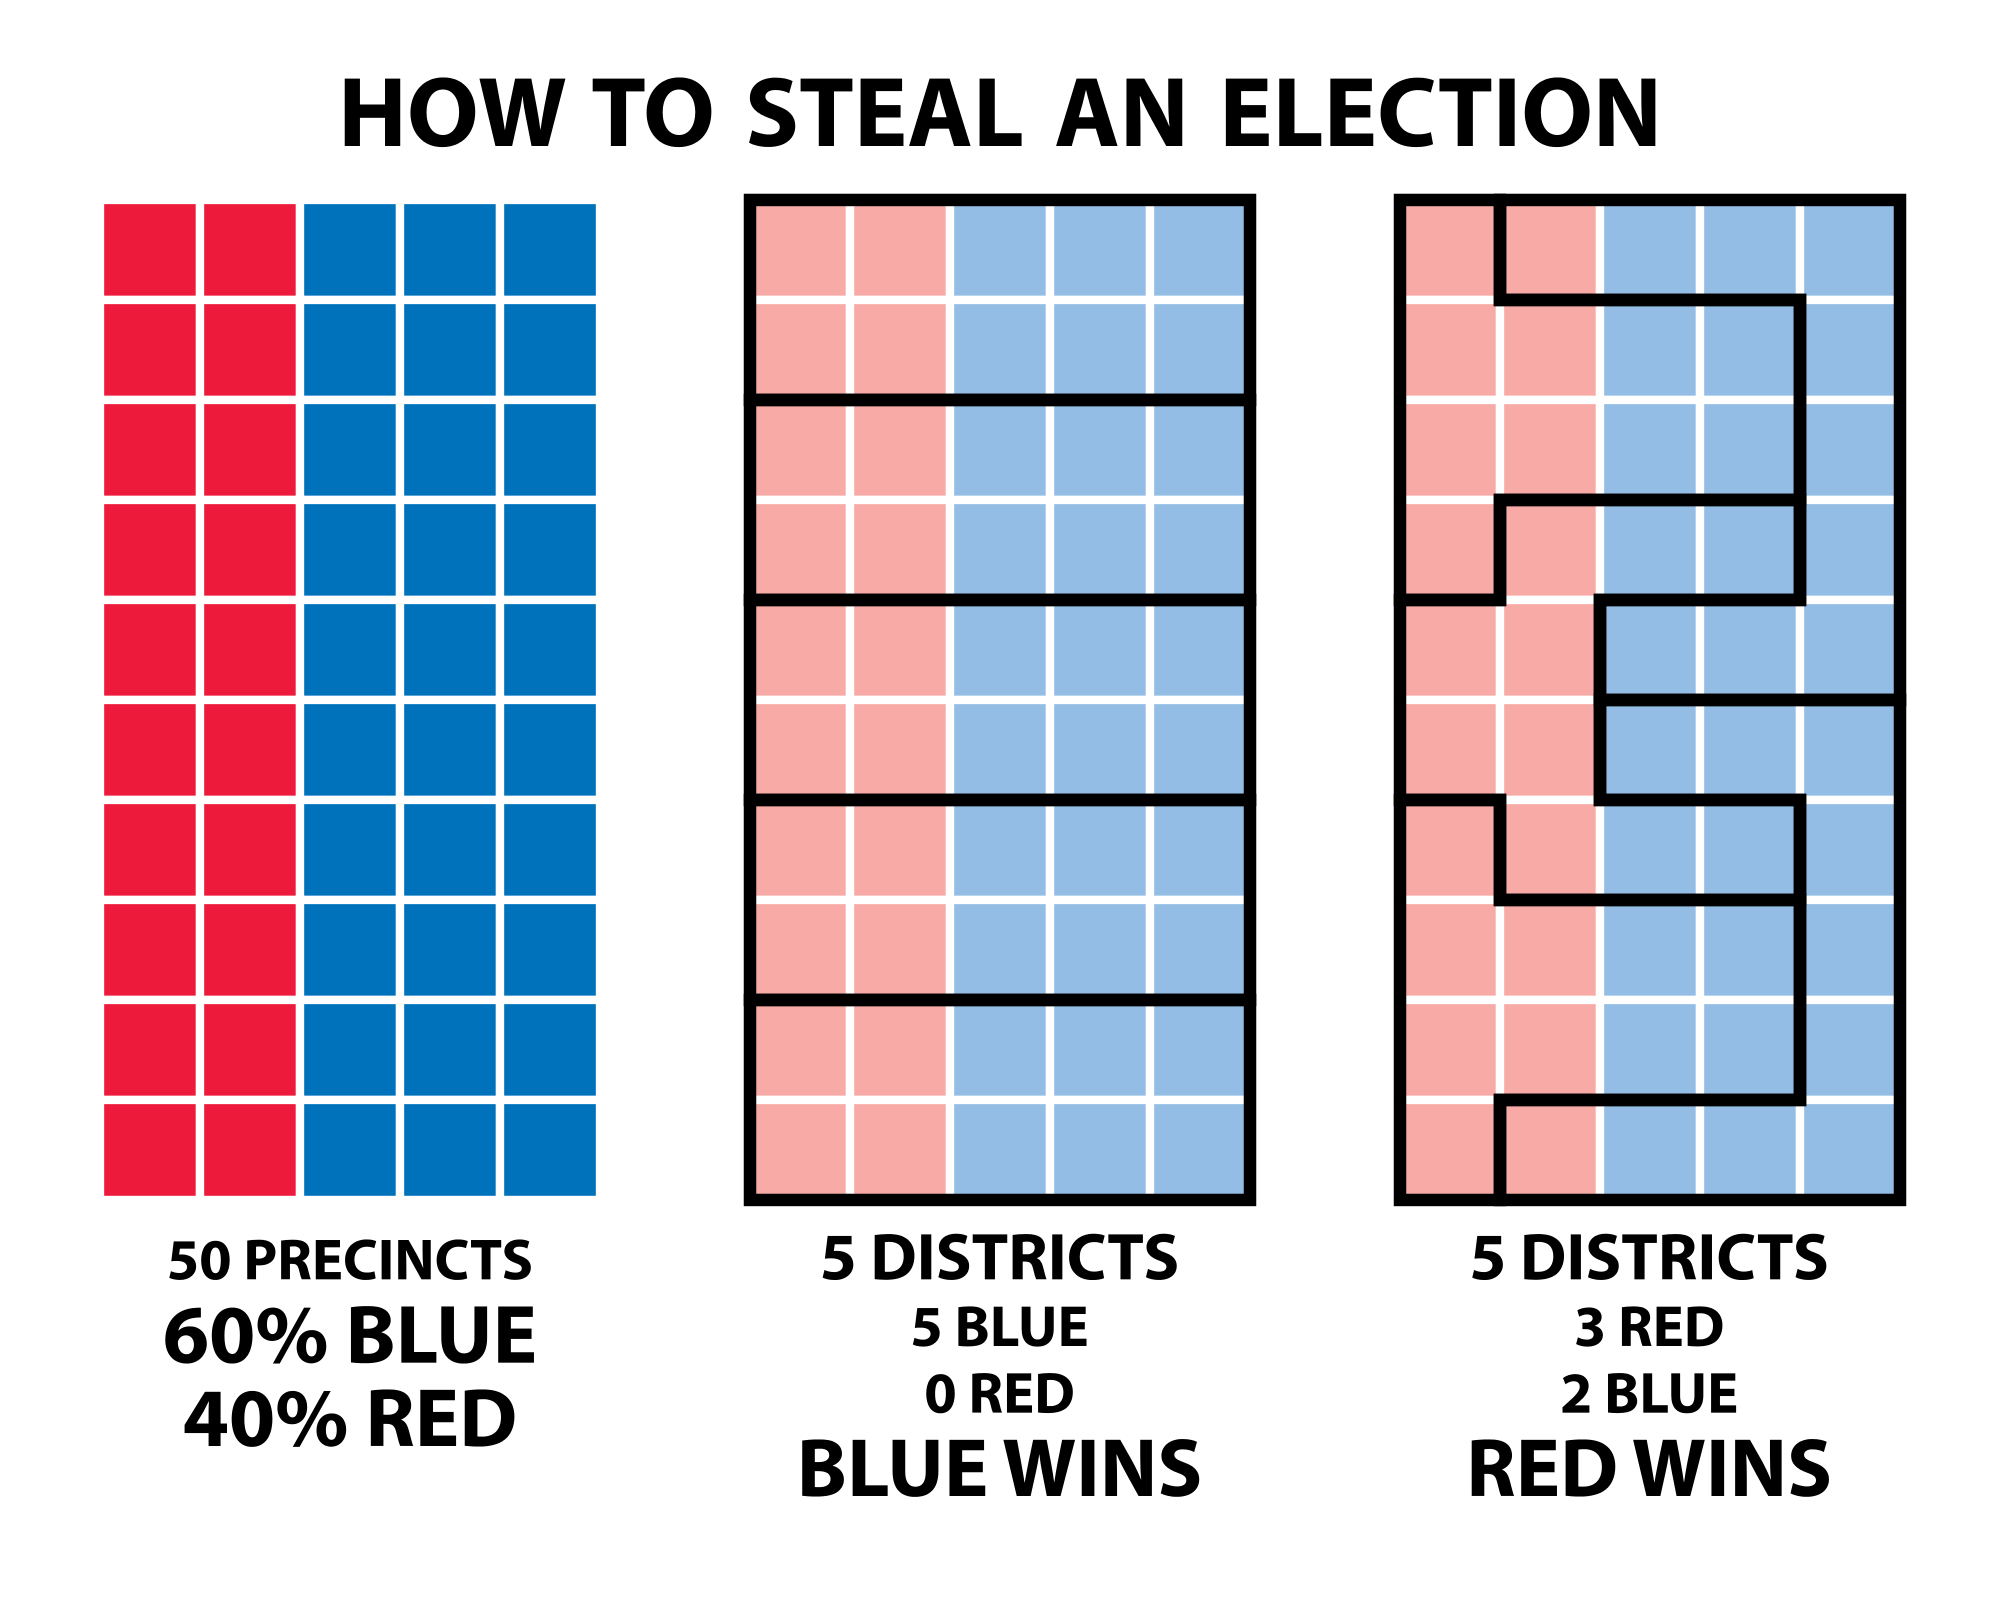
The above example shows how to redistrict. For each slide in this section (a total of three), you will show three different ways to redistrict 50 precincts. Each of your districts will comprise of ten squares. You may not duplicate what you see above, but try to figure out a different way to divide the districts in THREE different ways. You MUST use color or be able to differentiate the squares by using shading or texturing! Make sure you can show different majorities for each slide when you do this, just as the diagram above shows. Note that for the example above, in the second diagram, blue wins all five districts, and for the third diagram, red wins three and blue wins two. Start with the same diagram as you see above (on the left): 60% Blue, 40% Red. Then, draw your three districts, with a thick line to show how you have divided them up. Make sure to provide the number that determine who wins (red or blue)–just as you see in the two examples above (though, remember, you are providing three). Red must have the full advantage at least one time. This is tricky! Good luck!
To be clear, you will start with the first diagram, where you see ’50 Precincts’ and divide it up THREE different ways, with one diagram to be placed on its own slide (so, three slides in total for this section–one diagram on each slide), using thick lines, just as you see in the two examples entitled ‘Blue Wins’ and ‘Red Wins.’ Each district must contain ten squares.